
BatchDrake
Hacking, HAM Radio (EA1IYR), DSP, physics and more
Hacking, HAM Radio (EA1IYR), DSP, physics and more
Recently, I felt curious about those analog-looking FPV radio links used in many drone-like scenarios. In an era where DTV has succeeded and largely replaced analog TV technologies like PAL (here in Europe) or NTSC in the US, the chances to play with analog video signals are indeed small, and figuring them out is a technical challenge I always wanted to face. I week ago or so I felt the urge to satisfy my curiosity about this particular (and gradually disappearing) technology, so I made up my mind to finally buy one of those standalone FPV cameras and start looking into what they are transmitting to the air. It turns out they are relatively unexpensive (less than $20 in Amazon), so I bought one, plugged the only 5.8GHz-capable SDR receiver I have to my computer and recorded a relatively large (~700 MiB) capture.
The video signal produced by these cameras, even though NTSC-encoded, exhibit some modulation properties that heavily differ from what we would expect of old-style analog TV broadcasts in VHF and UHF. This is not surprising: while TV stations used an especifically allocated and protected portion of the spectrum, FPV cameras have to share the spectrum with many other different applications (remember 5.8 GHz is an ISM band), increasing the chance of accidental and harmful interference. Also, these devices suffer from strong power constrains (both techincally and legally). These limitations were addressed by replacing the traditional VSB modulation scheme used by analog TV broadcasts with FM (which is more robust against RFI and noise), in exchange of a larger bandwidth usage. As we will see later, this truly paid off.
It took me a little to locate the signal in the spectrum (the 5.8GHz band is huge!) but I finally found it somewhere around 5.74 GHz. This is what the spectrum looked like:
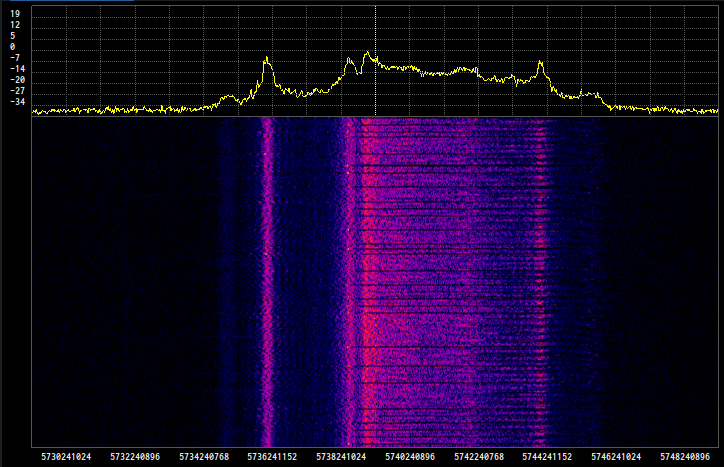
Fortunately for us, the relatively odd shape of this spectrum can be explained thanks to the modulation scheme used to encode the signal: Since this is a frequency-modulated signal, different immediate values of the modulated signal map linearly to a specific range of frequencies (roughly 9 MHz wide). This means that the spectrum is actually representing the histogram of the different values that the signal takes in time. Lower frequencies map to lower values of the modulated signal and, unsurprisingly, higher frequencies map to higher values. To explain this specific shape, we can take a look to what a time-domain baseband NTSC signal looks like
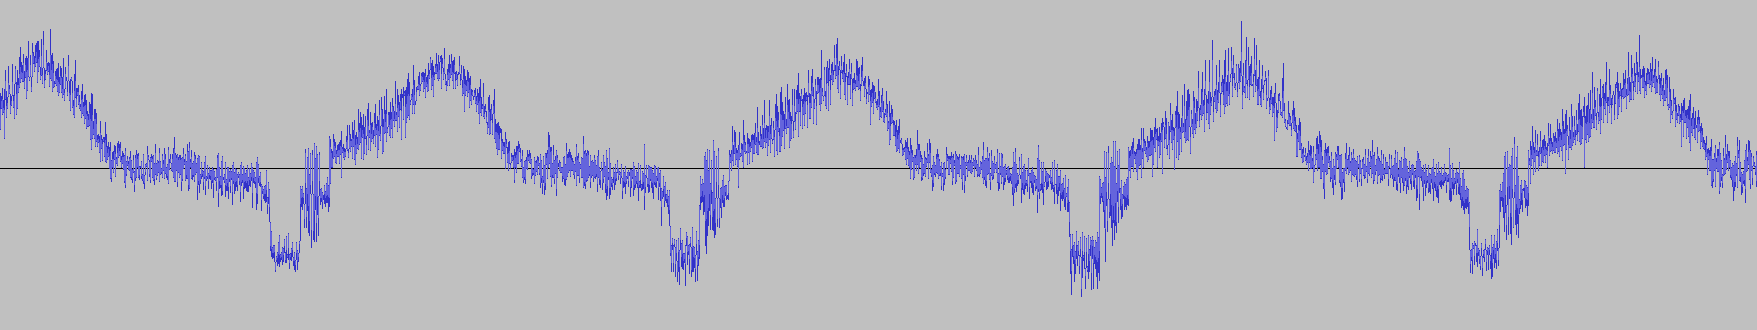
An NTSC video signal consists of a series of fixed-duration scanlines along the screen width, from left to right, and luma (i.e. brightness) is amplitude-modulated: levels around 0 are rendered as black, while higher levels are rendered brighter. Scanlines are separated by a fixed-duration negative (darker than black) pulse called horizontal sync pulse. The level of this pulse is always the same and therefore should show up as a fixed peak in the left of the spectrum (which is the case).
The picture information does not start immediately after the sync pulse: it is preceded by a black level interval (called the back porch) and followed by another black level interval (called the front porch). No matter how bright the scanline is, these black levels will always show up. Therefore, we should expect another peak somewere to the right of the first peak (which is also the case).
The remaining peaks are a representation of how likely is to find spcecific levels of brightness in the picture. As my camera was pointing to a relatively dark place of my apartment with a lamp in the right, we should also expect a blurry peak to the right of the second peak, and another peak further away, related to the bright colors of my lamp. As we can see, this was also the case.
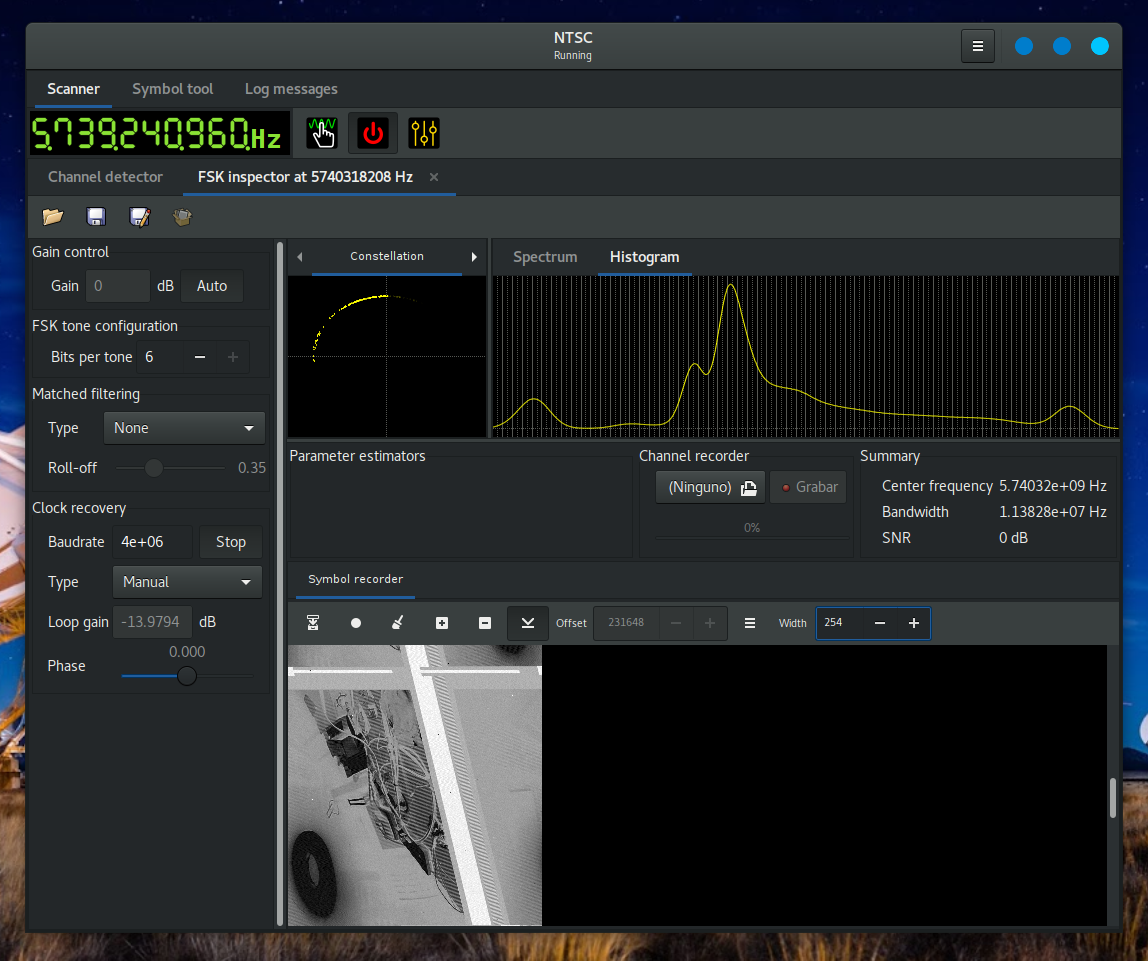
Suscan supports ASK, FSK and PSK demodulation. These are actually the digital versions of AM, FM and PM respectively. By picking the highest bits-per-symbol configuration in the FSK inspector (6 to the present day, or 64 different symbols) and disabling the automatic clock recovery loop, we can resample (and re-quantize) the analog signal and show it as a series of pixels with varying shades gray in Suscan’s symbol recorder. Since symbols are painted from left to right, we may be able to have an approximation of what the image would look like in an FPV receiver. Obiously, we cannot do this process in realtime (the minimum sample rate to capture the whole bandwidth of this signal is around 10 MHz), so I worked with a 20Msps raw I/Q capture I took from gqrx.
Choosing the appropriate symbol rate for this experiment is somewhat arbitrary, although it should be smaller than the channel sample rate and big enough to capture the smaller details of the picture. Since the luma signal has a bandwidth no bigger than 3.5 MHz, we can set the symbol rate to 4 Msps.
The result after some manual adjustments in the symbol recorder window width looked like this:
This was a huge success! As we can see in the symbol recorder, there’s a donut-shaped black object in the bottom-left corner (my lamp) and a bunch of stuff in the top-right corner (the table where I carried out my experiments). The histogram looks a lot like the power spectrum (this is expected) and horizontal sync pulses are shown as a thick white diagonal crossing the picture. The reason why tones are inverted is because I paint lower symbols in white and higher symbols in black. The picture looks rotated 90º counter clockwise because my camera was rotated 90º in the opposite direction. Also, the image looks slanted because the baudrate is not an integer multiple of the line frequency. We can do some postprocessing on the image to fix these details, and we would eventually get something like this:
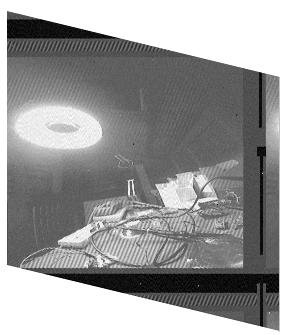
It is remarkable how clean the recovered picture was. This is mostly due to the modulation scheme used by this camera. We can also notice some strong diagonal patterns after the sync pulses and on top of my table. This is the chroma signal that we are accidentally demodulating and should be filtered out.
This was no more than a naive proof of concept, but we can definitely do better. In the next post, we will see how to code a small C application using sigutils to demodulate the FM signal, synchronize to the horizontal sync pulse and dump separate frames.
Stay tuned!